What is rectangle subdivision?
In my approach to rectangle subdivision, you take a rectangle (or a square) and then you split or subdivide it along its longest side. Then you take your two new shapes and you subdivide both of them along their longest sides again. With rectangle subdivision, you can make the subdivision even or uneven and make the line of subdivision straight or angled.
📓: this tutorial assumes knowledge of manipulating lists and using the packages dplyr and ggplot2. I am not asserting that this is the only or best way of approaching rectangle subdivision. This is just my personal approach.
Why aren’t you just giving us your code?
I personally believe when people ask for my code, the true request is a desire to understand the approach that gave rise to my end product. Having my code just helps you recreate my work. Getting an understanding of how I approach polygon subdivision means you can implement or modify my approach in a way that best fits your needs.
Set up
To follow along with this post, you will need two packages: {dplyr} to create and manipulate your data and {ggplot2} to visualize the output. So lets load our libraries.
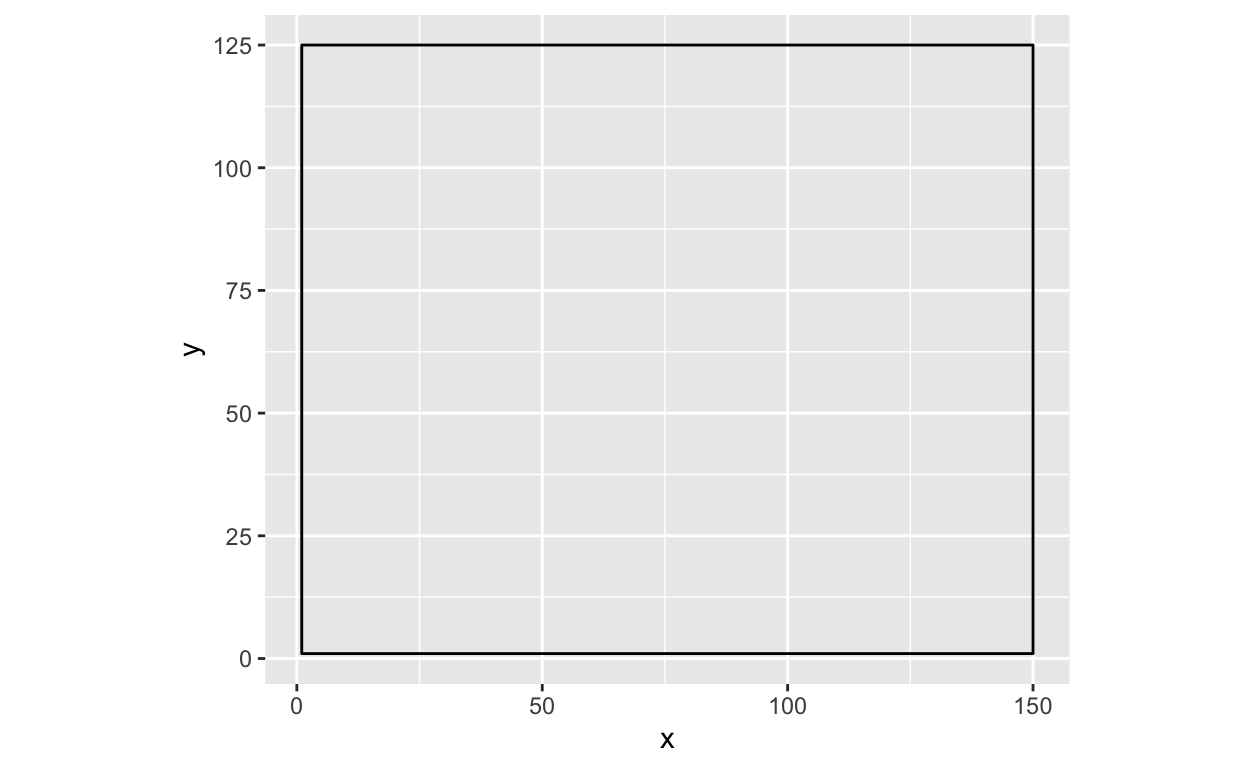
I like to start with a nice decent sized rectangle and I create it using a tibble like so:
Find the vertices
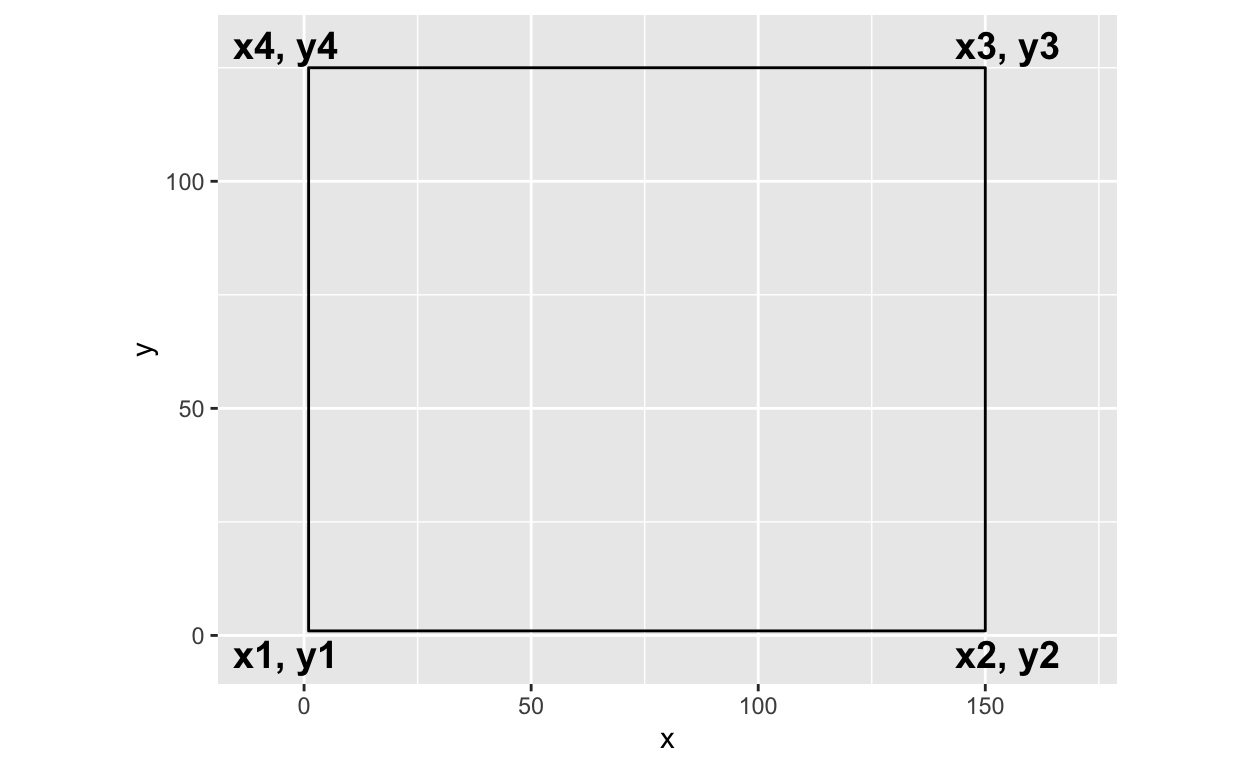
In order to subdivide your rectangle, you need to know the location of its vertices. In this post, I will refer to the vertices of each rectangle as x1-x4 and y1-y4. These vertices are named counterclockwise, starting from the bottom left. For example, x1 in the rectangle is located at (x = 1, y = 1) and x2 is located at (x = 150, y = 1).
In order to quickly pull and access the vertices of each rectangle - I like to use a function I created called get_vertices(). This function takes in a dataframe that has a column x and a column y and then pulls the values from the dataframe into the relevent vertices variable within a list. This function works partially because I always create the rectangle dataframe in the order I discussed before, i.e. x1 is always the first item in the x column and so forth.
So lets apply get_vertices() to our initial rectangle dataframe to create a list of all the vertices.
vertices = rectangle %>%
  get_vertices()

vertices
$x1
[1] 1

$y1
[1] 1

$x2
[1] 150

$y2
[1] 1

$x3
[1] 150

$y3
[1] 125

$x4
[1] 1

$y4
[1] 125
Subdivide the rectangle
In this example, we will do even subdivision which means that we will split our rectangle exactly in half. In this approach when we subdivide our rectangles, we want to do it along its longest side. This maximizes the amount of subdivisions you can do before your shapes become too small. In this case, the longest side is the horizontal width of the rectangle or the “x side”. You can confirm the longest side by subtracting the vertices.
# Determines length of "x side"
abs(vertices$x2 - vertices$x1)
[1] 149# Determines length of "y side"
abs(vertices$y3 - vertices$y2)
[1] 124💡: you should use x2 and x1 to determine the length of x and y3 and y2 to determine the length of y. This is because based on how we defined the y vertices above, y1 is equal to y2 and y4 is equal to y3. See below!
vertices$y1 == vertices$y2
[1] TRUEvertices$y3 == vertices$y4
[1] TRUESince we are splitting our rectangle exactly in half, we need to find the midpoint between x1 and x2. The best way to do so is to use the midpoint formula: \[ (x, y) = (x_1 + x_2)/ 2 , (y_1 + y_2)/2\]
Because we only want the midpoint for the x coordinates for this instance (because the x is the longest side), we can simplify the formula and only use the following:
midpoint = (vertices$x1 + vertices$x2) / 2
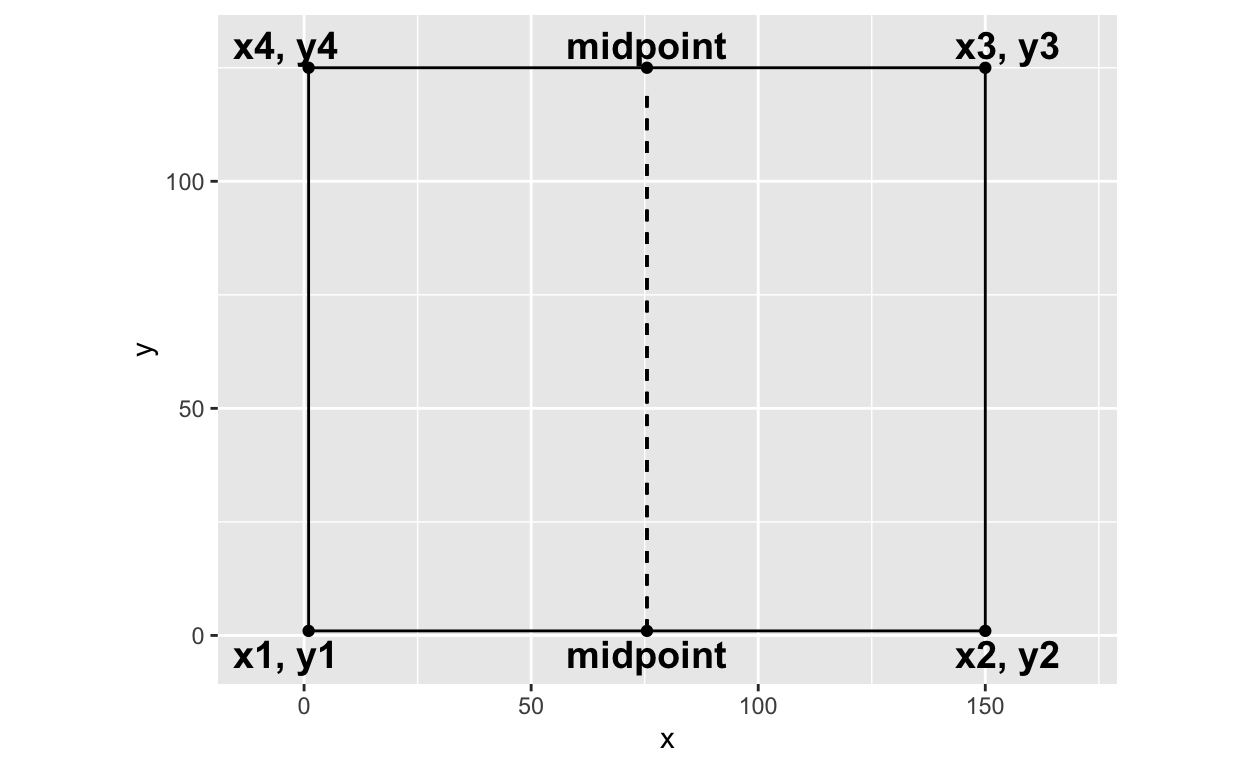
So now we have an additional coordinate in our rectangle available to us. We have x1-x4, y1-y4, and the midpoint of x. Lets visualize it! Below is our original rectangle, but now the location of the midpoint is labeled.
My personal approach to subdivision is a “find and replace” approach. There are other approaches but this best fits my mental model regarding shapes.
The above rectangle needs to be split into two rectangles using the midpoint as a new vertex. Therefore, the leftmost rectangle new coordinates will be (going counterclockwise): 1) (x1, y1), 2) (midpoint, y2), 3) (midpoint, y3), 4) (x4, y4). The y vertices do not need to change - but the x2 and x3 vertices need to be updated to the midpoint.
Then the rightmost rectangle’s new coordinates will be: 1) (midpoint, y1), 2) (x2, y2), 3) (x3, y3), and 4) (midpoint, y4)
I do so by creating a new dataframe for the rectangles using the coordinates as laid out above.
new_rectangle = list()

# LEFTMOST RECTANGLE
new_rectangle[[1]] = tibble(
  x = c(vertices$x1, midpoint, midpoint, vertices$x4),
  y = c(vertices$y1, vertices$y2, vertices$y3, vertices$y4),
  group = LETTERS[1]
)

# RIGHTMOST RECTANGLE
new_rectangle[[2]] = tibble(
  x = c(midpoint, vertices$x2, vertices$x3, midpoint),
  y = c(vertices$y1, vertices$y2, vertices$y3, vertices$y4),
  group = LETTERS[2]
)

# Using bind_rows() to combine into a dataframe
final_rectangles = bind_rows(new_rectangle)
💡: When you have a dataframe with multiple polygons, the way to tell ggplot2 to distinguish between them is to use a group variable. The group variable lets ggplot2 know, these set of coordinates are part of group A and then these other set of coordinates are part of group B, and so forth. I like to use the LETTERS vector that comes with base R for my groups.
Gaze upon your new rectangles
So our new data frame should contain the x, y vertices for two rectangles and they each should have their own group (group A and group B).
| x | y | group |
|---|---|---|
| 1.0 | 1 | A |
| 75.5 | 1 | A |
| 75.5 | 125 | A |
| 1.0 | 125 | A |
| 75.5 | 1 | B |
| 150.0 | 1 | B |
| 150.0 | 125 | B |
| 75.5 | 125 | B |
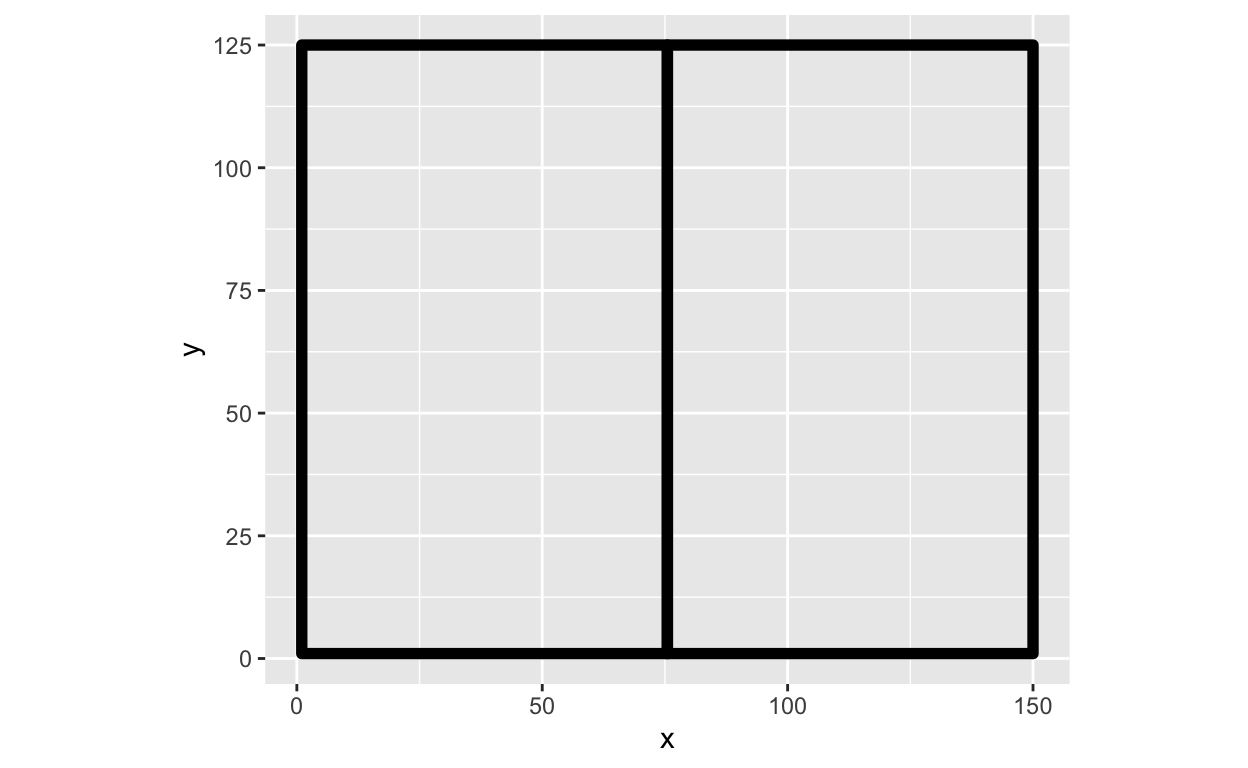
This dataframe when used in geom_polygon() allows us to have an output of our two new rectangles.
ggplot() +
  geom_polygon(data = final_rectangles,
               aes(x = x, y = y,
                   group = group),
               size = 2,
               fill = NA,
               color = "black") +
  coord_equal()
Et voila ✨! You then repeat the above process for as many subdivision iterations as you would want. I personally have all of the above in a series of functions that allow me to continue to subdivide the rectangle, until I reach the number of desired iterations. Happy subdividing!