Computational and generative art
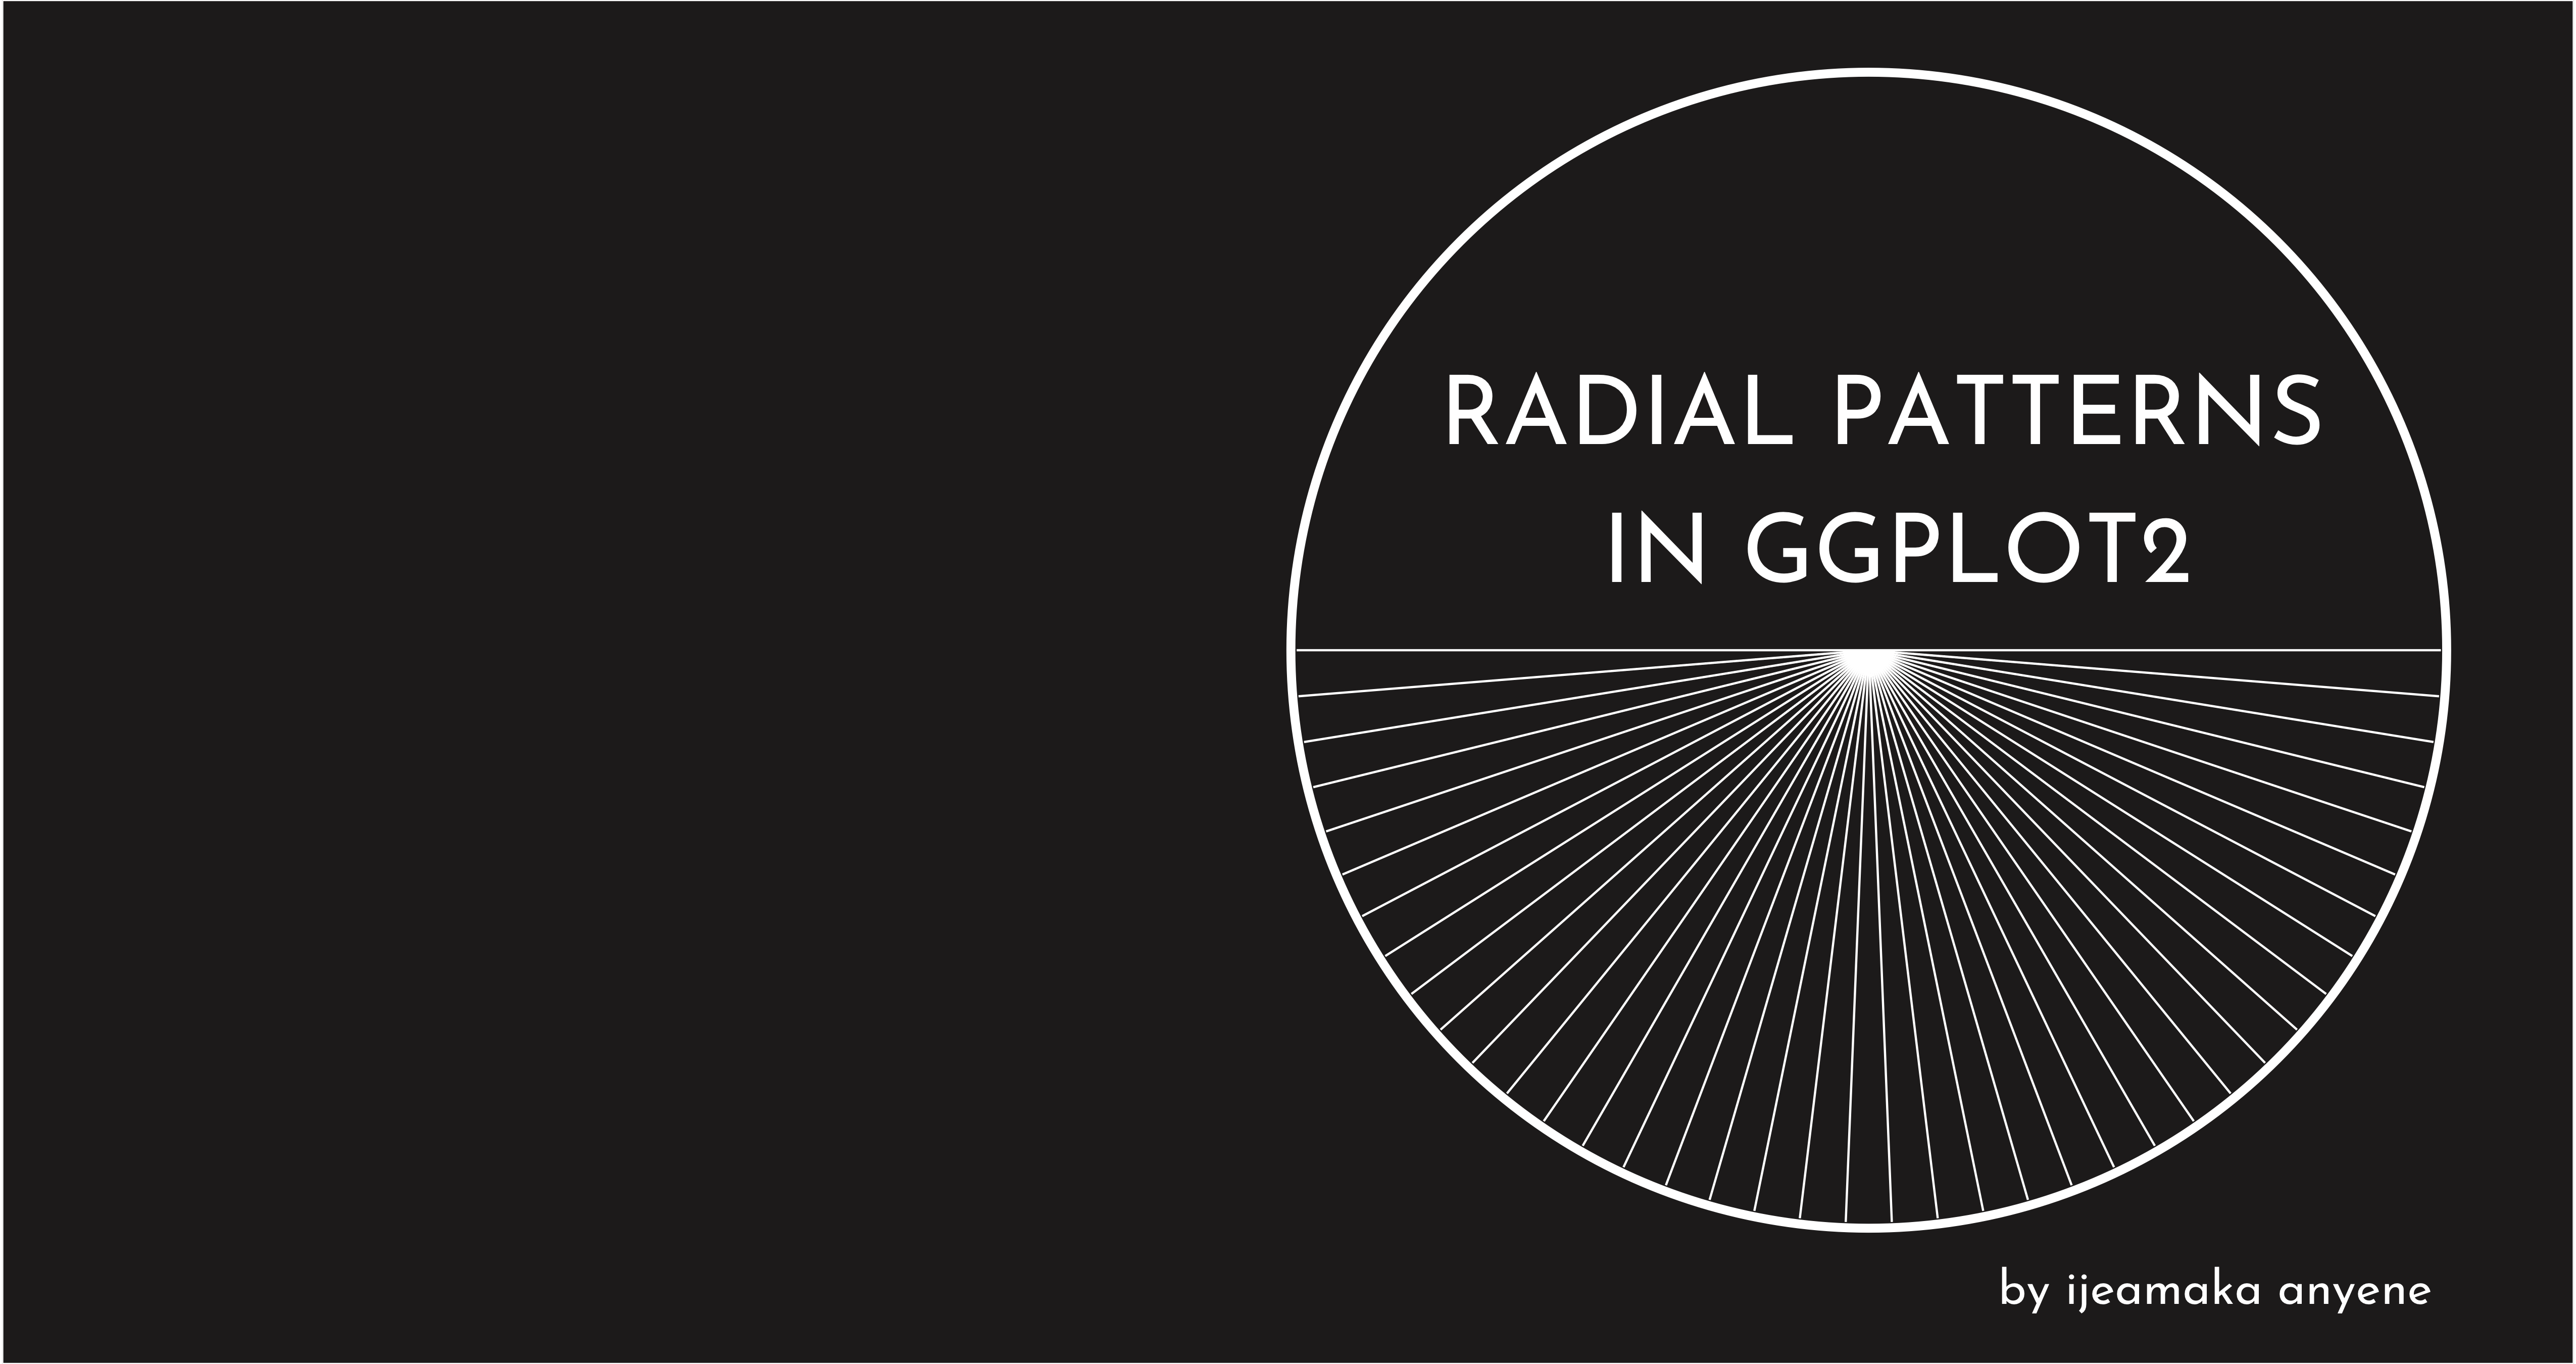
Radial Patterns in ggplot2
A love letter to coord_polar() masquerading as a #rstats zine, 2021
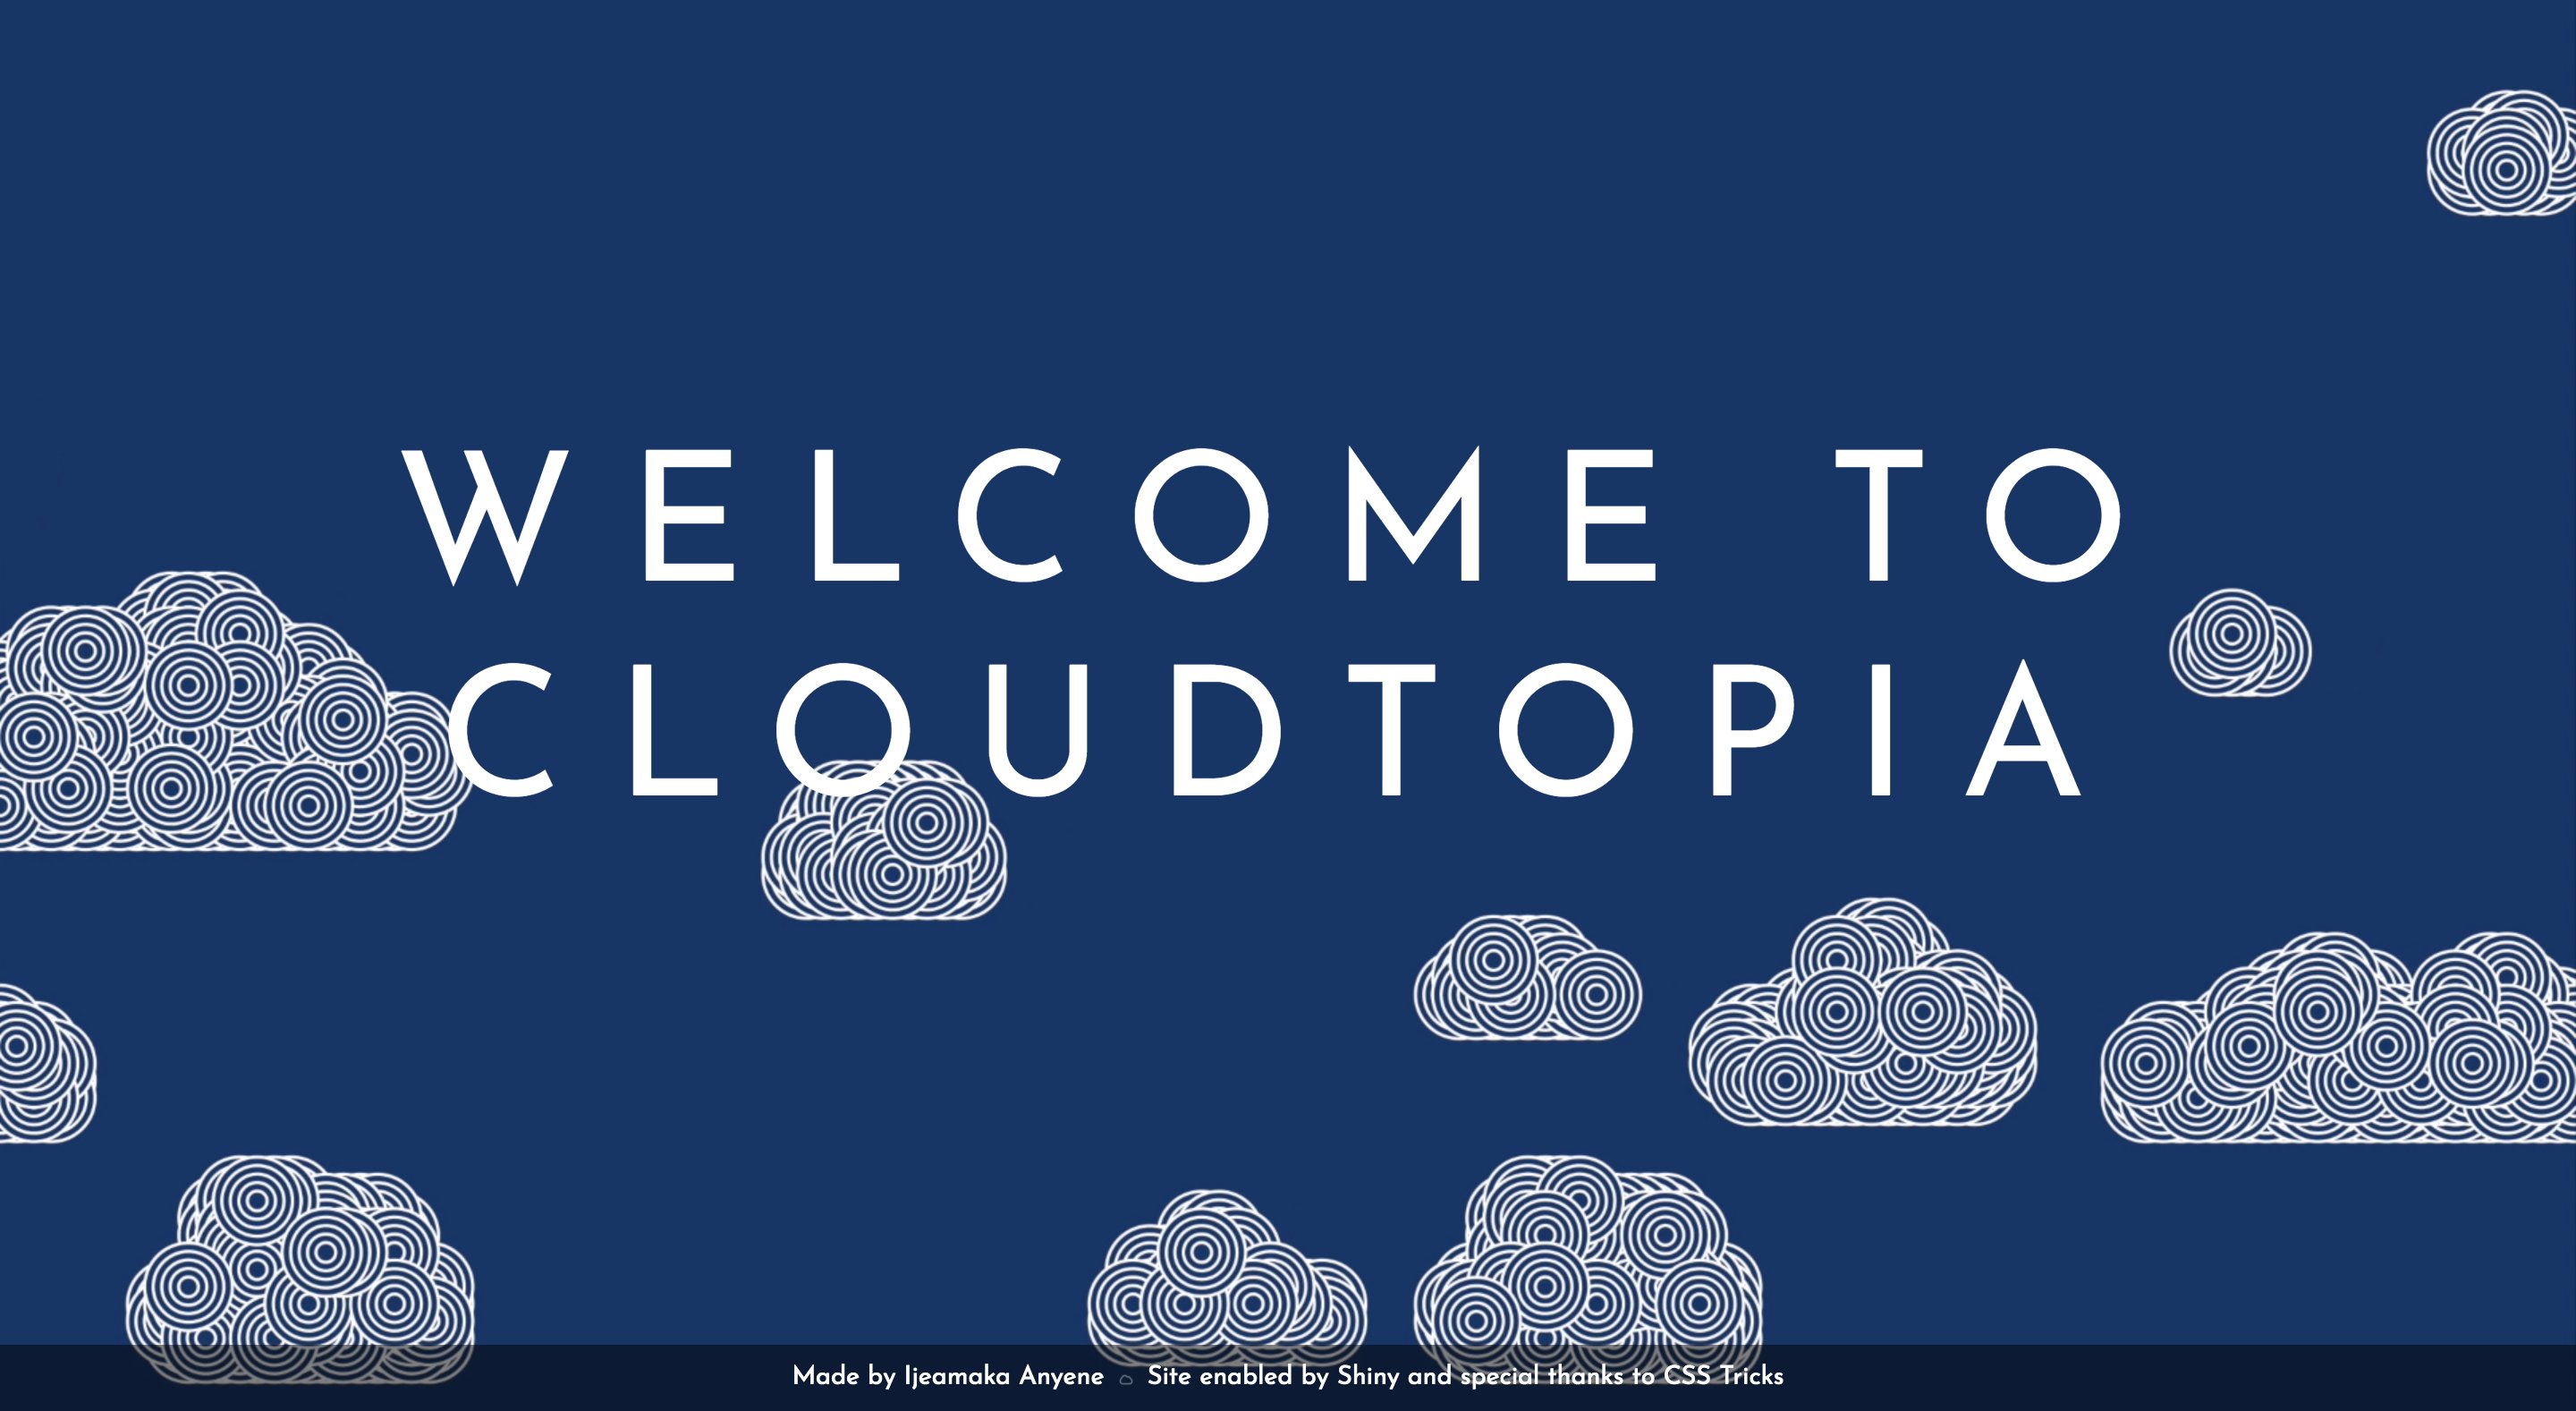
Cloudscape
a shiny app of a short looping video of a cloudscape, 2021
Data visualizations
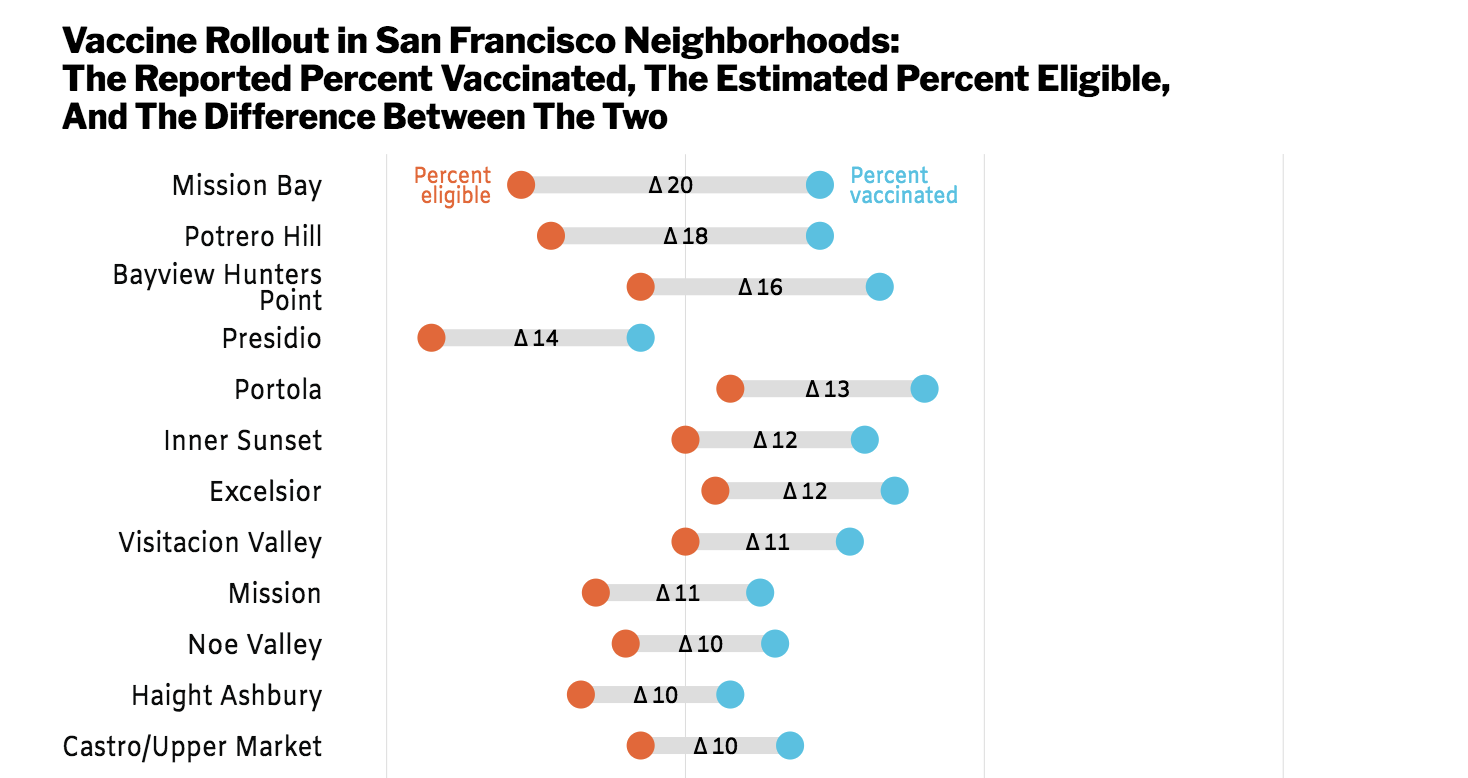
Vaccine Rollout in San Francisco Neighborhoods
Data visualization and analysis for Here Say Media, 2021
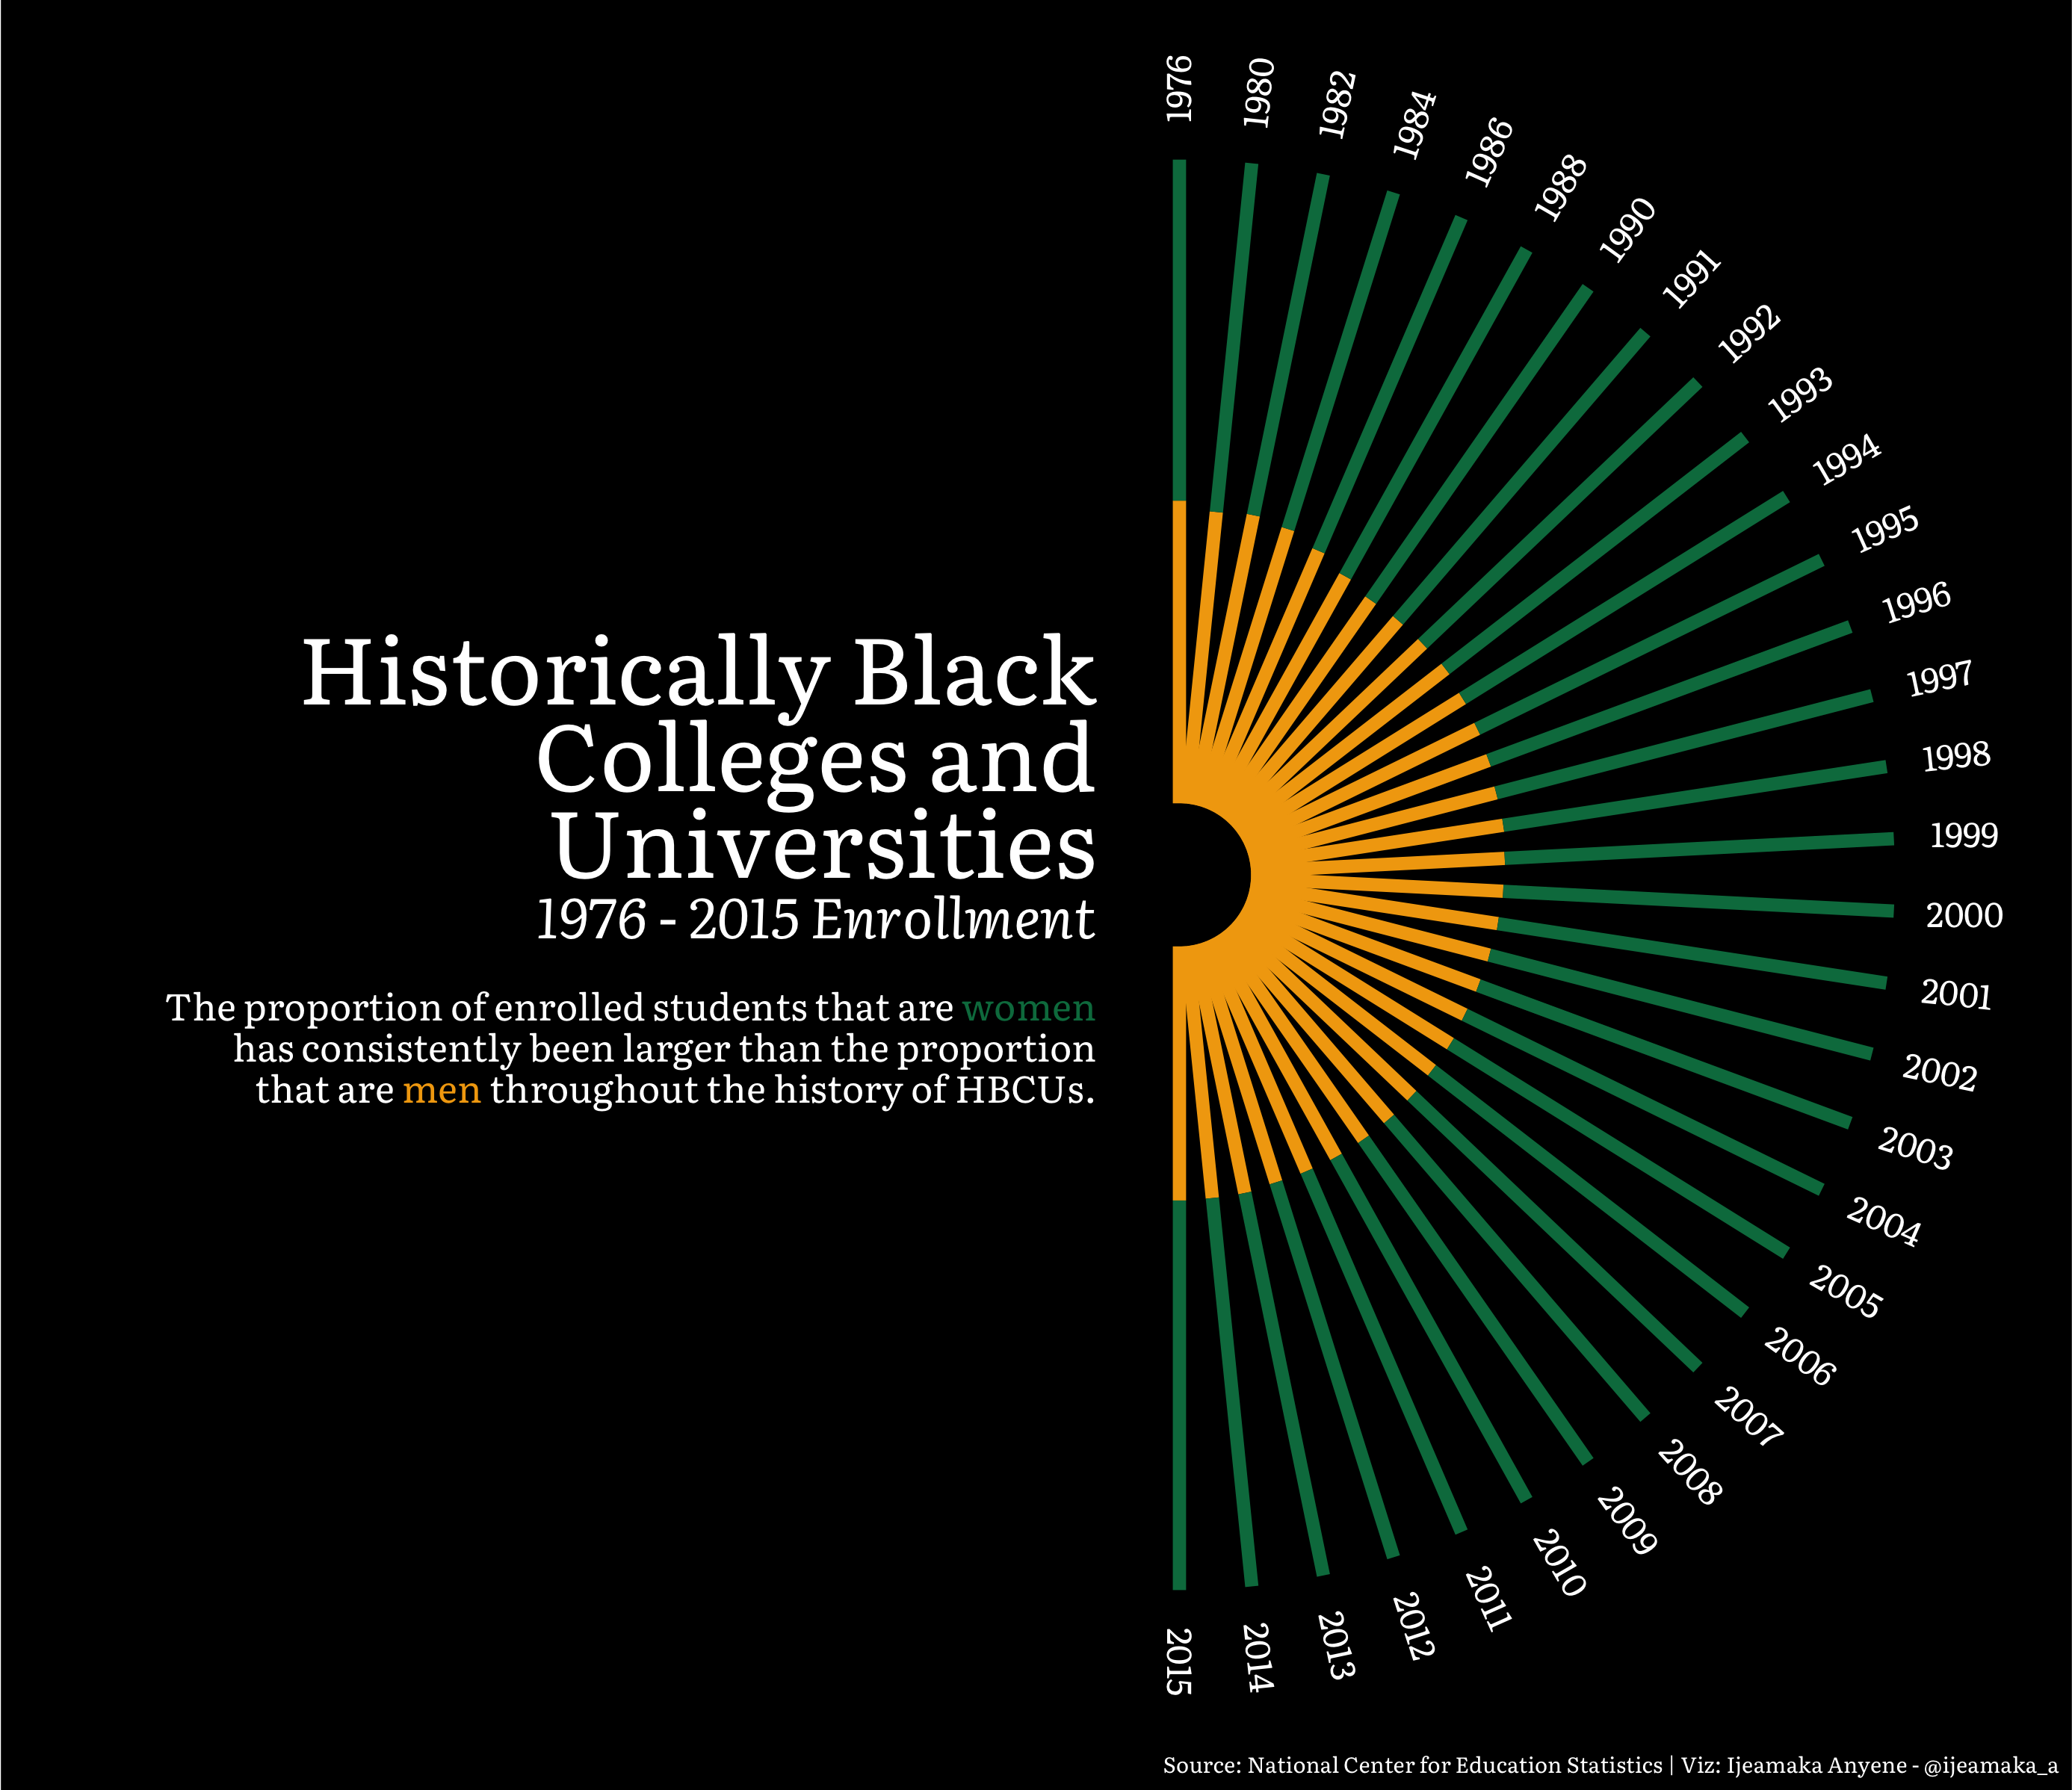
TidyTuesday
A #R4DS Weekly Challenge. I am a regular contributor and all of my visualization are created solely using {ggplot2} and other extension packages, 2020
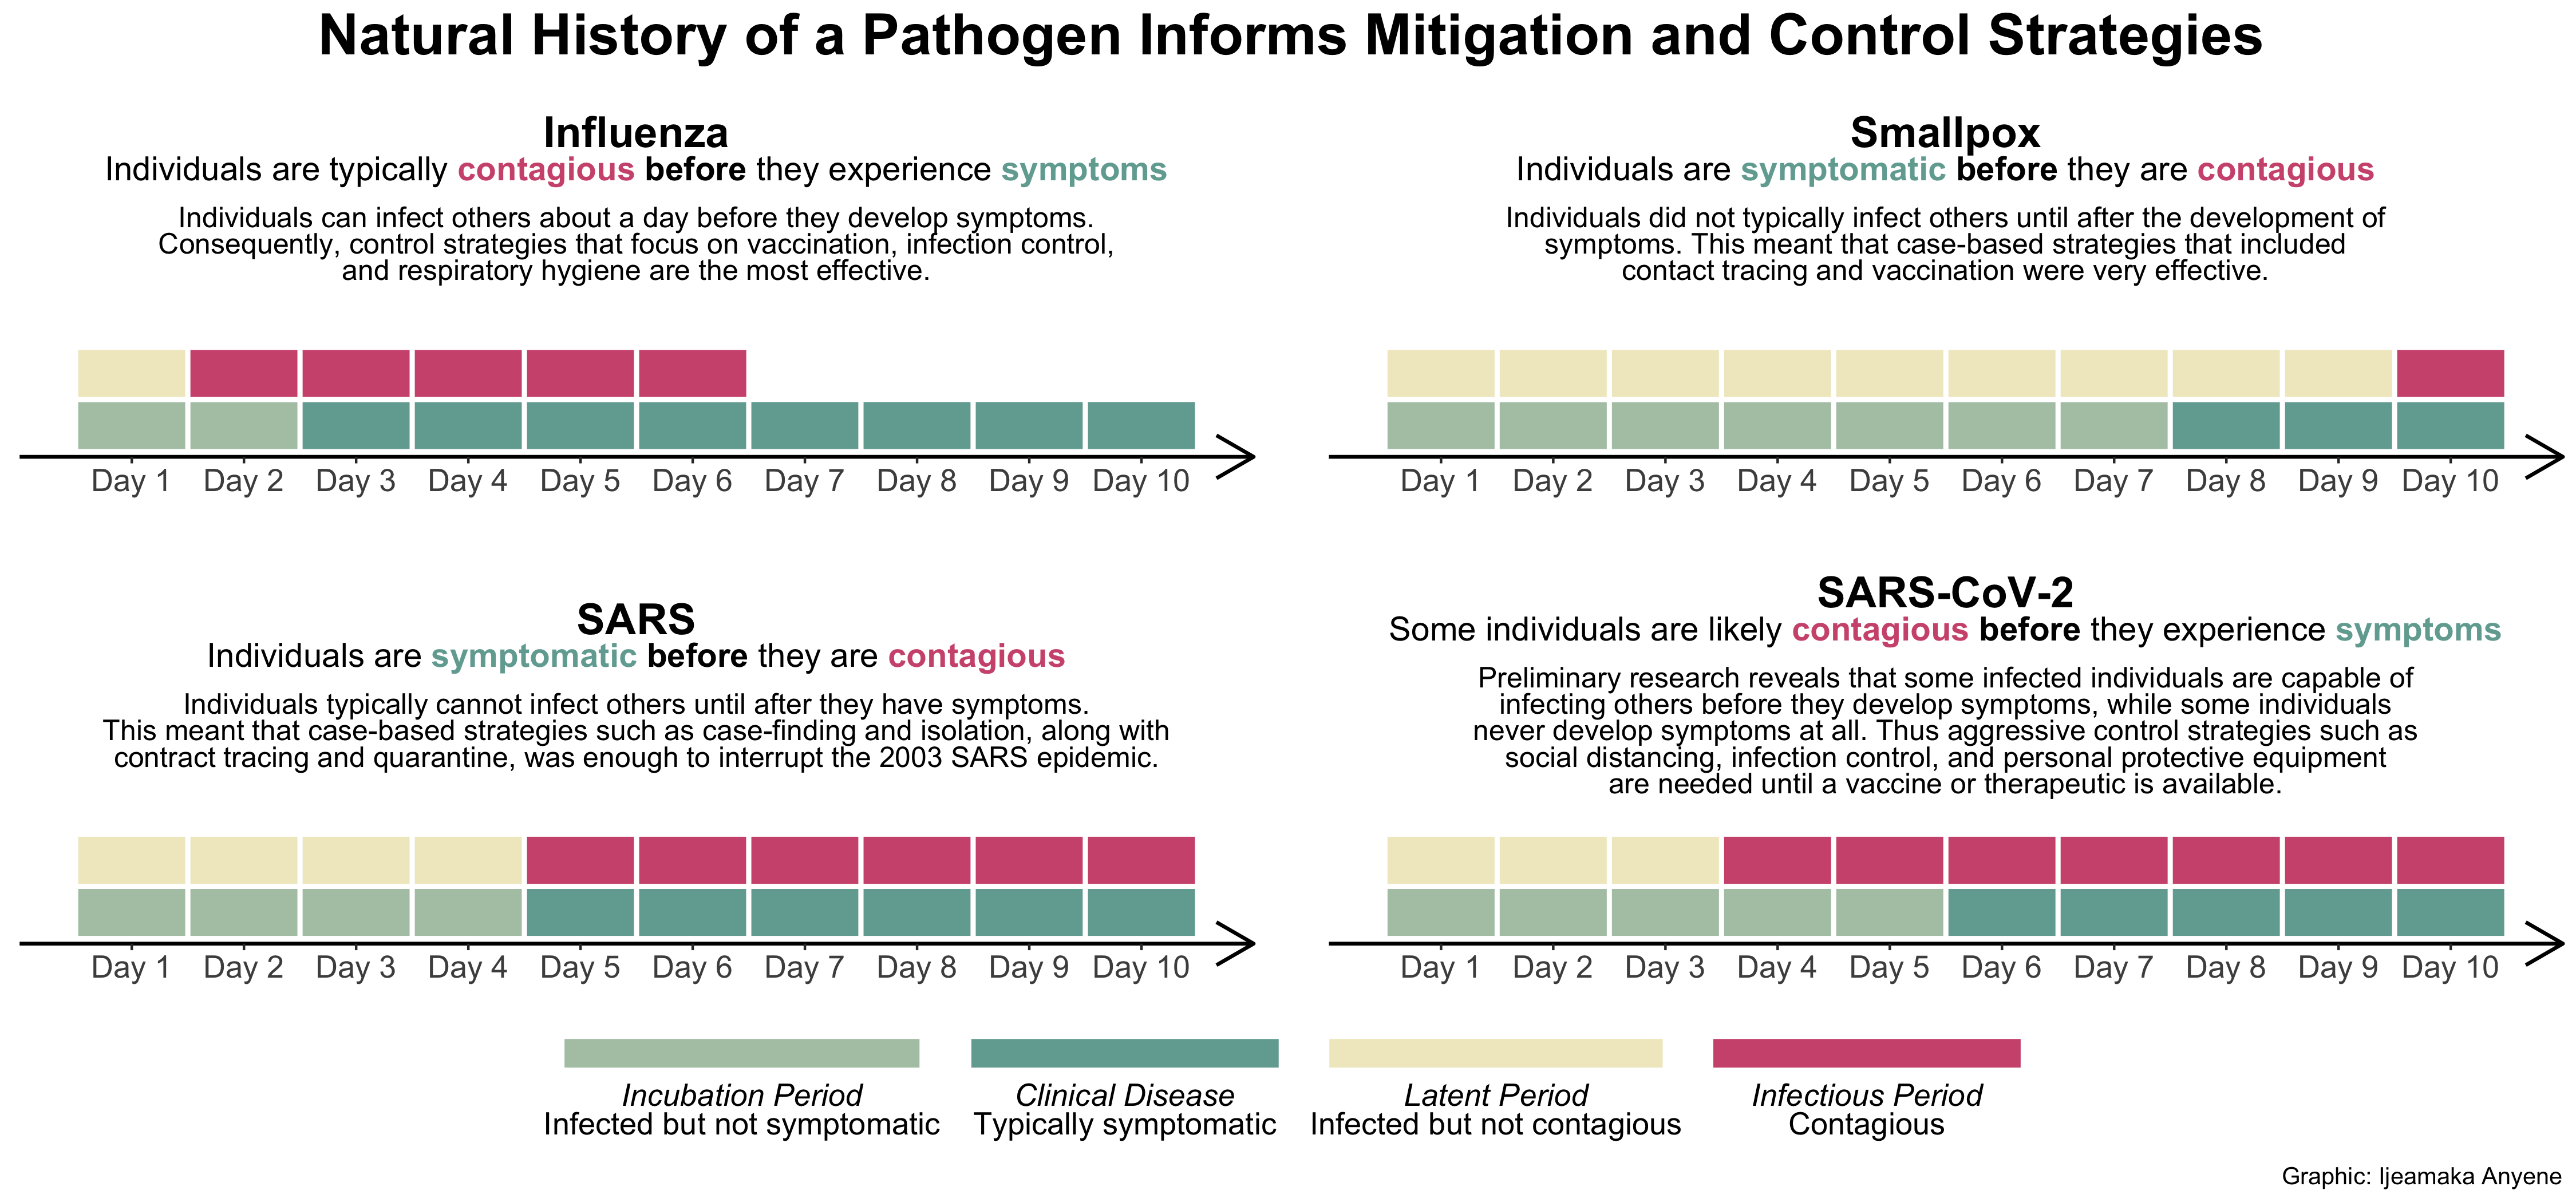
COVID-19 Visualization
An infectious disease natural history primer for U.C. Berkeley School of Public Health, 2020
Shiny apps and package development

rtistry art gallery
A celebration and showcase of art in all of its forms created by the #rstats community. An entry for the RStudio 2021 Shiny Competition, 2021
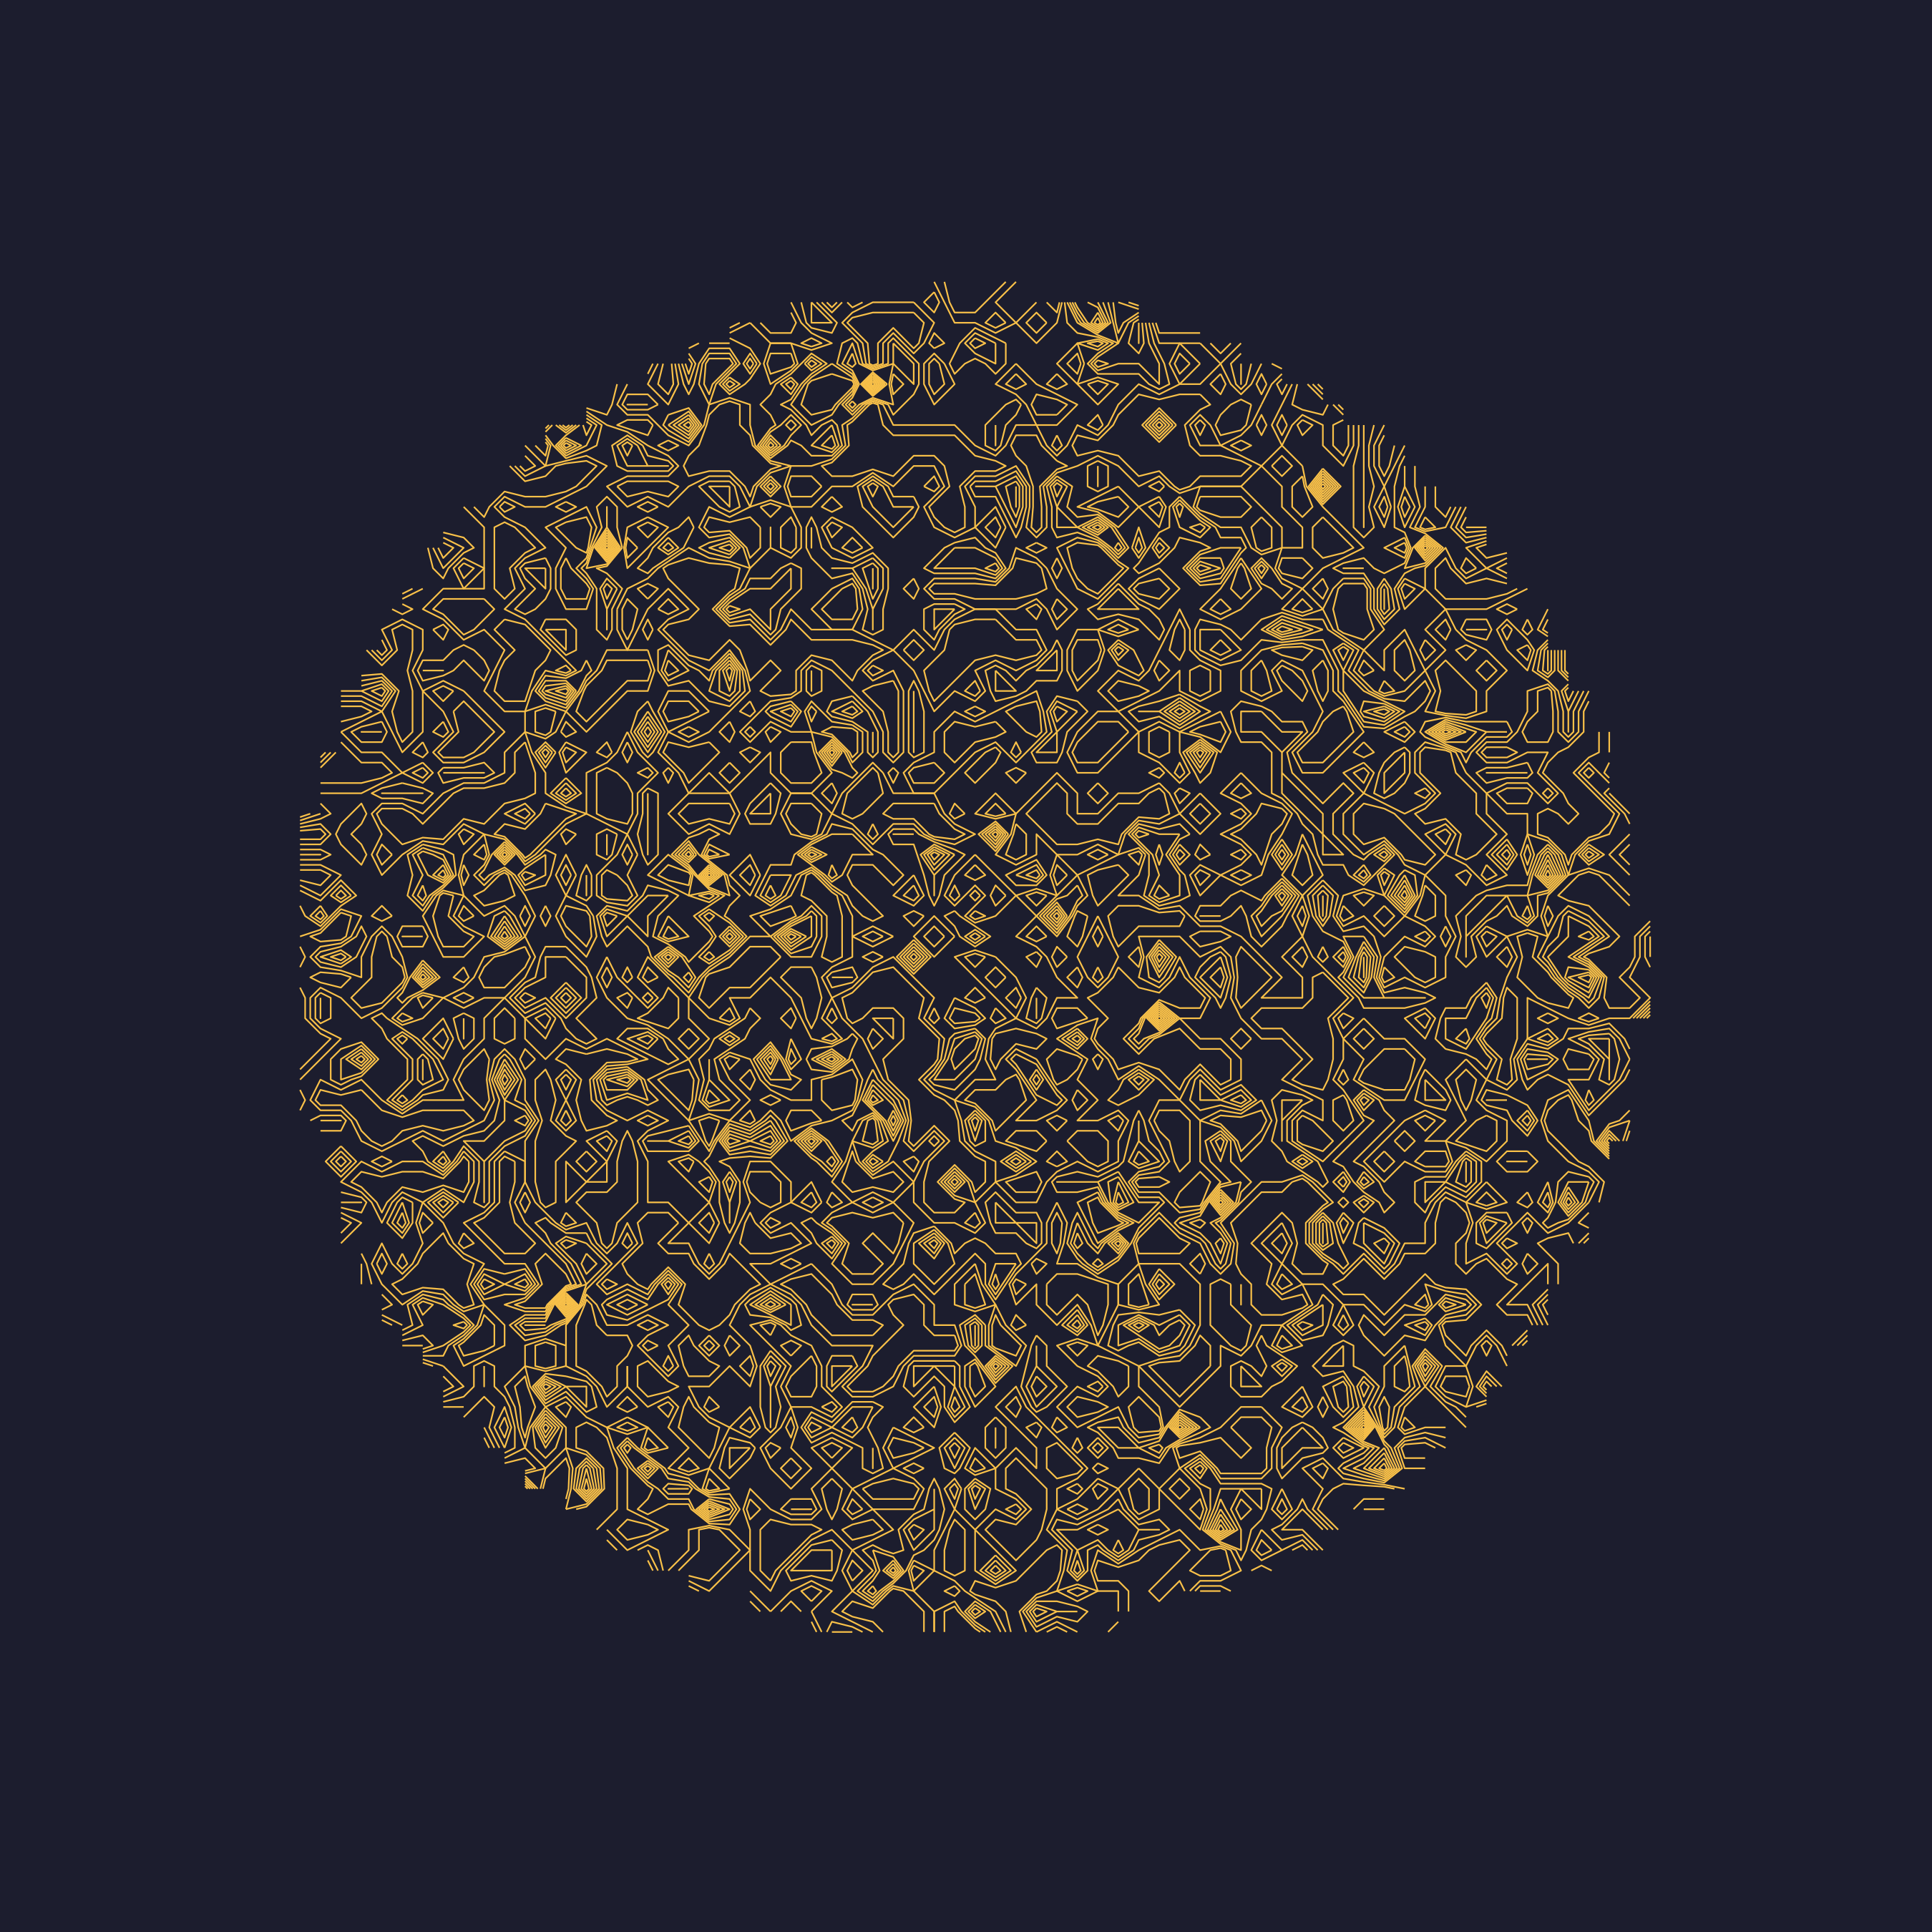
{contouR}
An R package for creating patterns using geom_contour(), 2021